
Stephen Kenny's first home match at the Aviva is one he will want to forget as Ireland were beaten 1-0 by Finland last Sunday. The Finns have qualified for Euro 2020 but are no great shakes, as John Giles might say. But they were well organised and took their goal chance. Ireland on the other hand didn't create many chances and faded badly.
We had data analyst Dominic Corrigan crunch the numbers for the match, with a special focus on Possession Value Added. Possession Value is a popular metric for gauging a player's performance. Essentially, PVA measures the increase or decrease in the likelihood of a possession ending in a goal based on the successful passes a team makes. This is a really important metric for Stephen Kenny as he looks to instil a playing philosophy that values possession, and hopefully leads to more goals.
So how did we do against Finland, from a statistical perspective? Click the graphs below to see the findings in detail.
Chart #1 - PVA gameflow 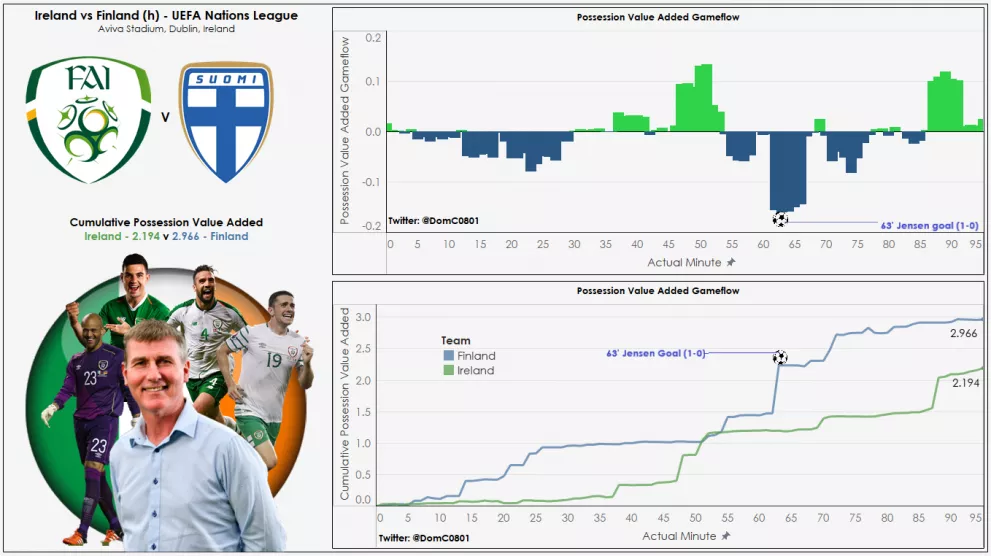

Here are some immediate takeaways from the PVA chart.
You can really see the Ireland's fatigue levels represented in data form. During the twenty minutes of the game, when Ireland should have been chasing a goal, Finland were actually doing a better job of building scoring opportunities. Other than a period of dominance in the 45th-50th minute and a spell at the end of the match, the data shows Ireland were outperformed by the Finns.
While Ireland's cumulative PVA for the match was better than the Bulgaria game, we were still outperformed by Finland who finished with a cumulative PVA 2.966, which means they did enough work to create three goals.
Now let's track how Ireland players performed on an individual basis in terms of PVA.
Chart #2 - Touch Map and individual PVA
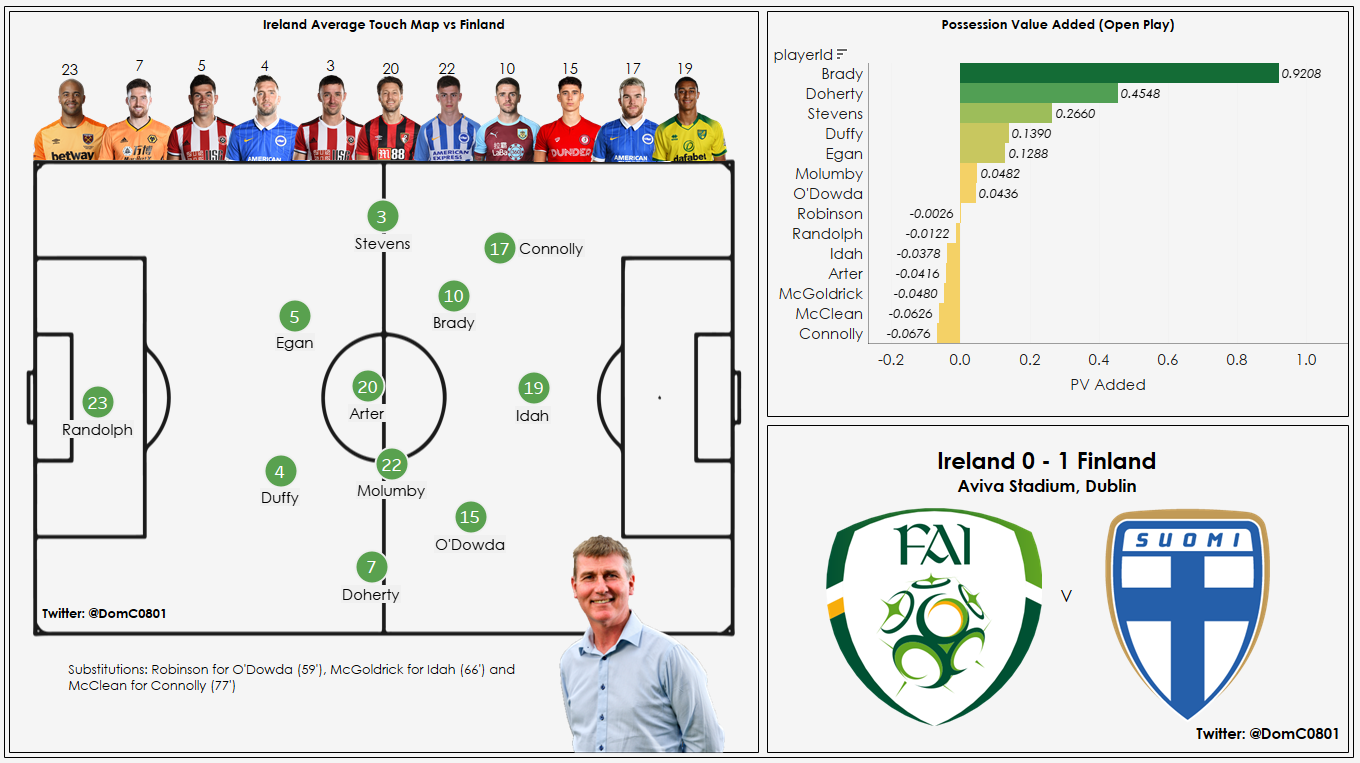
Here are some learnings for Ireland fans. Robbie Brady excelled against Finland with his passing increasing the likelihood that Ireland would score from possessions he was involved in by 92%. No surprise then that he was man of the match.
Seven players had a negative PVA in the game against Finland compared to 5 against Bulgaria. In layman’s terms this means that the passing of seven Ireland players resulted in a decreased chance of Ireland scoring in those possessions. That's a worrying statistic for Stephen Kenny.
There was a marked difference in how our midfield operated compared to the Bulgaria game. Doherty did not get as far forward and Jeff Hendrick was replaced by debutante Jayson Molumby who played much deeper. This allowed Robbie Brady to push forward on the left-hand side.
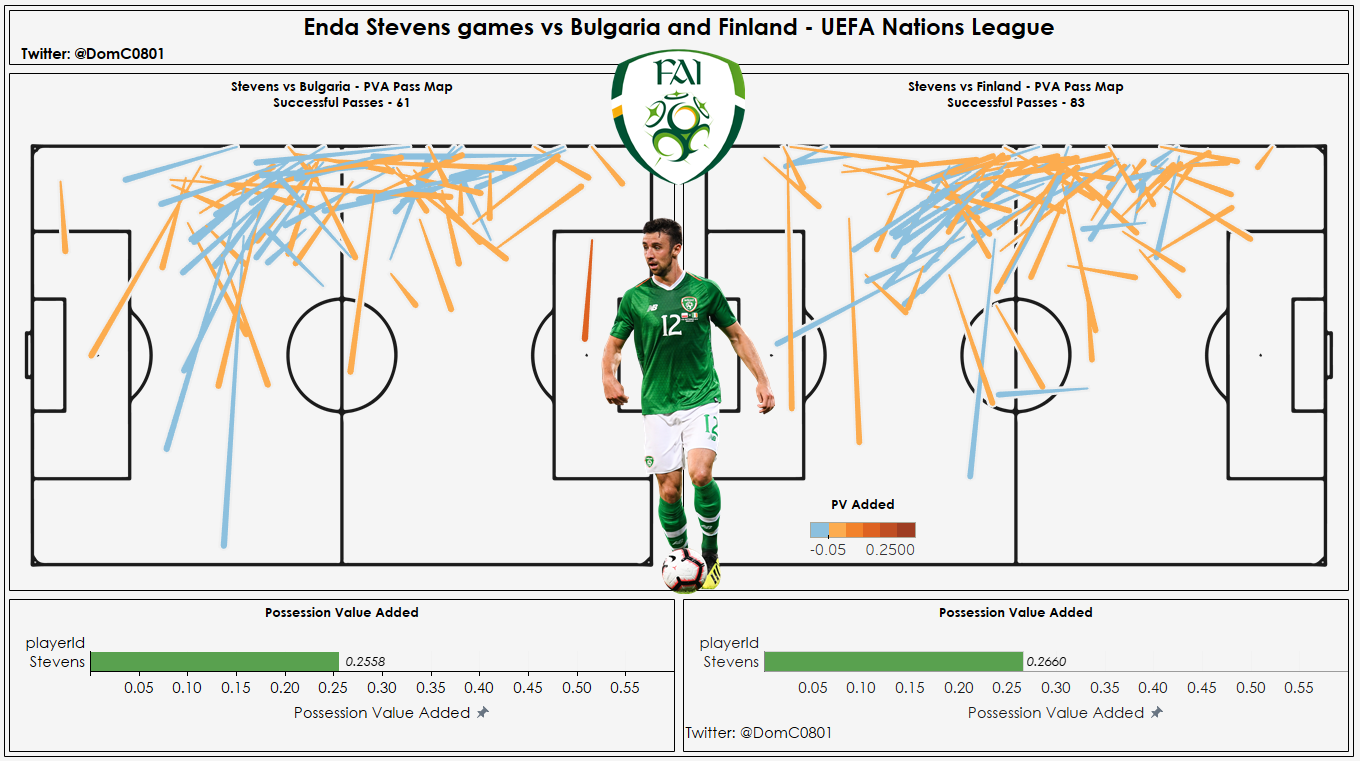
From the PVA Pass Map below of Enda Stevens, we can see he was far more involved in the game against Finland, which is likely a result of the introduction of Robbie Brady and the left-sided bias in possession.
We can also see that Harry Arter had a negative impact on Ireland’s passing against the Finnish whereas James McCarthy, who played the same role against the Bulgarians, increased Ireland’s chances of scoring by 20%.